Rising Sea Levels in Singapore: Interactive 3D Flood Map
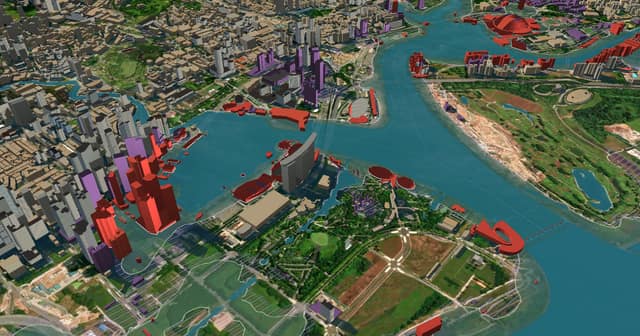
Rising Shores Singapore is a free, interactive 3D map that shows how rising sea levels could flood Singapore. Drag the sea-level gauge to raise the ocean above today's level and watch the coastline, buildings, roads and MRT stations go underwater, from Marina Bay and the Central Business District to Changi Airport, East Coast Park, Sentosa, and the reclaimed shores of Tuas and Jurong Island.
How much will sea levels rise in Singapore?
Singapore's Third National Climate Change Study (V3, 2024) projects mean sea level could rise by up to 1.15 m by 2100, and high-end projections reach about 2 m by 2150. With an extreme high tide and a storm surge on top, the sea could briefly stand 4 to 5 m above today's mean level, and about 30% of the island lies less than 5 m above it. Read the full explainer: rising sea levels in Singapore, projections, risks and how the country is preparing.
What floods in Singapore, and when
The flood extent is driven by the Copernicus GLO-30 digital elevation model, so the water follows the real terrain: low-lying reclaimed land and river mouths flood first, while higher inland ground stays dry. A scenario picker follows three emissions pathways year by year to 2150 (CCRS V3 2024, Ng et al. 2025, IPCC AR6), with an optional storm surge on top.
How the visualiser works
Every building is a real OpenStreetMap footprint with a measured height; a building turns red the moment the rising sea reaches its base, and violet while the elevation data cannot tell. You can switch between live satellite imagery and a dark map, toggle the MRT and LRT network, population density and a 1944 survey map, check a postal code, and read the share of land flooded, buildings touched and residents affected at any sea level.
Data sources
Elevation and flood extent: Copernicus GLO-30 DEM (ESA / Airbus). Satellite imagery: © Esri, Maxar, Earthstar Geographics. Buildings, water bodies and the MRT network: © OpenStreetMap contributors (ODbL), with building heights from 3D-GloBFP (Che et al. 2024). Coastline and boundaries: data.gov.sg (URA, NParks, PUB). Resident population per planning area (2025): Singapore Department of Statistics, General Household Survey 2025 (Singapore Open Data Licence), used to estimate how many residents live in flooded areas. Sea-level-rise scenarios: CCRS V3 (2024), Ng et al. 2025, and IPCC AR6: medians, illustrative, and not official planning levels.
Rising Shores Singapore is an independent project by Damien Mazeas. The interactive map needs a modern browser with WebGL enabled.