 Rising Shores Singapore
Rising sea levels in Singapore: how much, where, and what is being done
Short answer. Singapore's Third National Climate Change Study (V3, 2024) projects that mean sea level around Singapore could rise by up to 1.15 m by 2100, and high-end projections reach about 2 m by 2150. Add an extreme high tide and a storm surge on top, and the sea could briefly stand 4 to 5 m above today's mean level. Roughly 30% of the island lies less than 5 m above mean sea level, which is why coastal protection is a national priority.
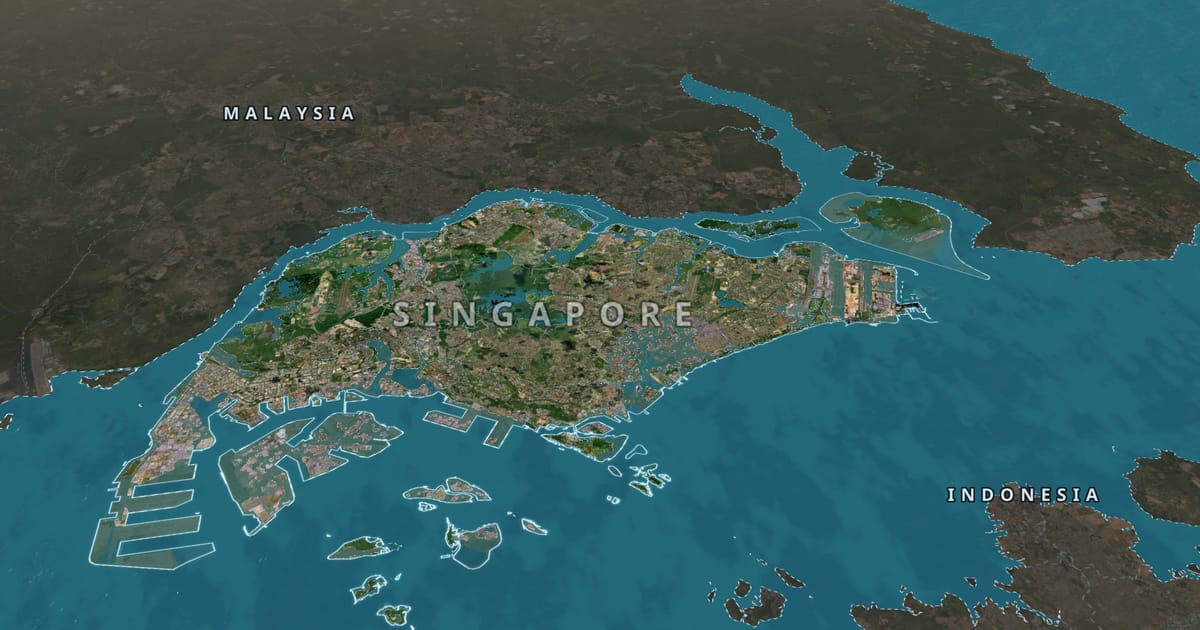
How much will the sea rise in Singapore?
Projections depend mostly on how much greenhouse gas the world emits. The map uses three pathways, each a median projection relative to 2025, built from Singapore's V3 study, a 2025 peer-reviewed study of Singapore's sea level (Ng et al., JGR Oceans) and the IPCC's Sixth Assessment Report.
| Scenario | 2050 | 2100 | 2150 |
|---|---|---|---|
| Current policies (SSP2-4.5) | +0.11 | +0.49 | +0.87 |
| High emissions (SSP5-8.5) | +0.14 | +0.71 | +1.29 |
| High-end (SSP5-8.5, upper range) | +0.25 | +1.07 | +2.07 |
Each figure links to the map with the sea raised to that level.
Two things make the long-term numbers matter more than they look. First, the rise does not stop in 2100: every pathway keeps climbing to 2150 and beyond. Second, the damage comes from extremes riding on top of the mean: an extreme high tide plus a storm surge can add more than a metre for a few hours, and a higher baseline makes those events both more frequent and more severe.
Why Singapore is exposed
- It is low. About a third of the island sits less than 5 m above mean sea level, and much of the city's most valuable land is on the coast.
- Much of the coast is reclaimed. Marina Bay, the East Coast, Changi, Tuas and Jurong Island were built out into the sea; you can compare today's shoreline with the 1944 survey map on the 3D map.
- Rain and sea meet. Heavy tropical downpours that coincide with a high tide are harder to drain, so rising seas also raise the stakes for inland flooding.
What floods first?
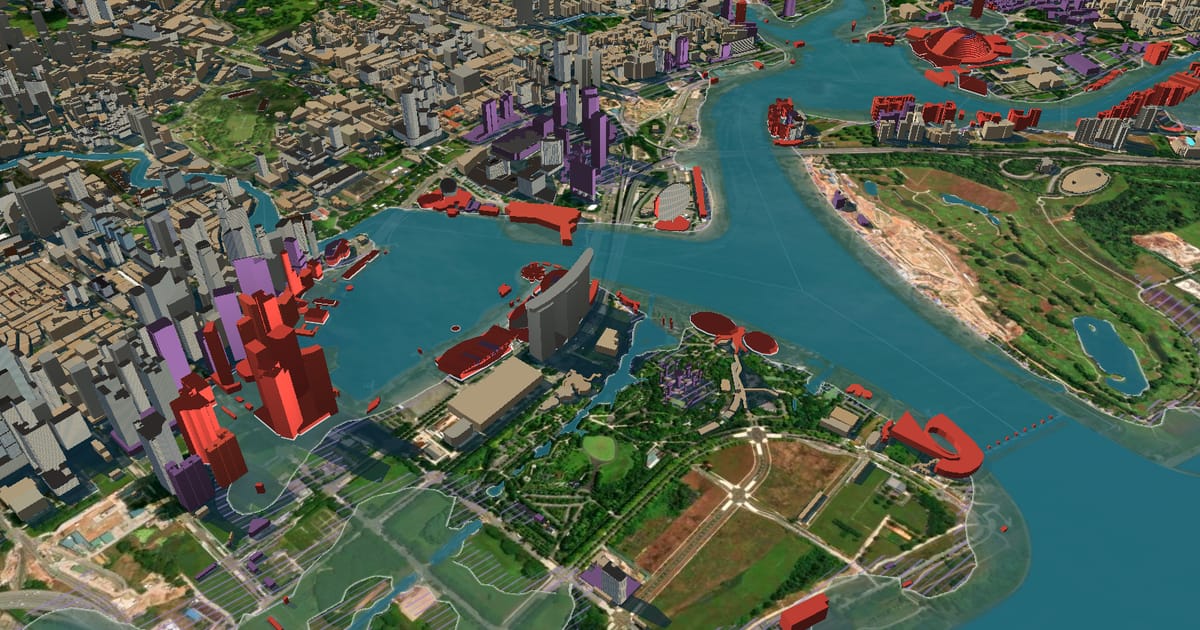
On the map, the sea follows the real terrain from a 30 m satellite elevation model. As it rises, it reaches reclaimed waterfronts and river mouths first, while higher inland ground stays dry. The two views below are the same camera over Marina Bay, before and after a 2 m rise.
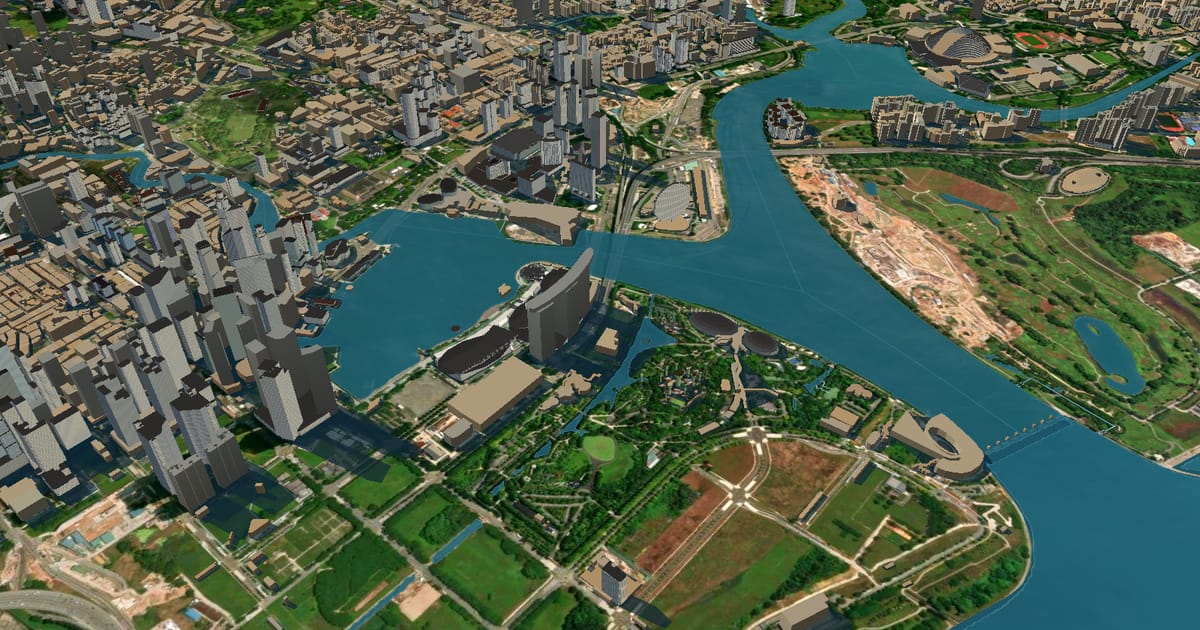
reached by the sea too close to call (±0.75 m) dry
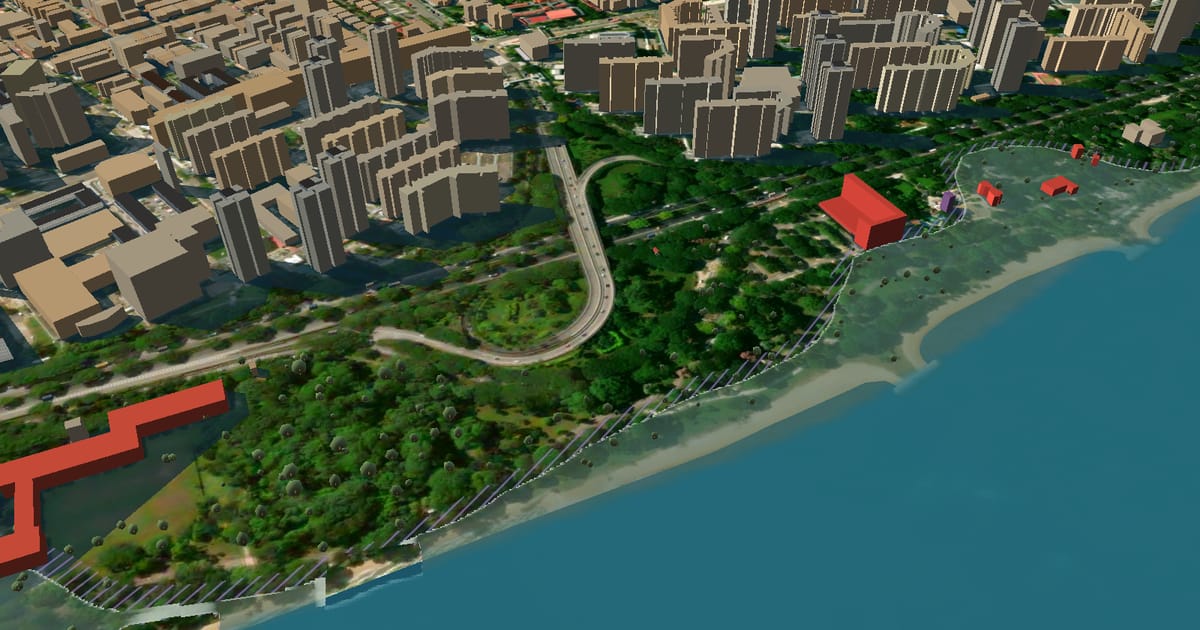
Read it as "if nothing were built". The map does not model sea walls, the Marina Barrage, drains, waves or rainfall: it shows which ground lies below a given sea level and is connected to the sea. That is exactly the picture Singapore's coastal-protection programme exists to prevent.
How Singapore is preparing
PUB, the national water agency, leads Singapore's coastal and flood protection. According to the National Climate Change Secretariat and the Singapore Green Plan 2030:
- Site-specific studies of the coastline began in 2021, one stretch at a time. The study of the City–East Coast stretch, completed in 2025, recommends coastal barriers along the Greater Southern Waterfront and a mix of raised structures and tidal gates at Changi.
- Long Island, announced in 2023, would reclaim about 800 hectares off the East Coast to shield the low-lying coast behind it, and add a new reservoir.
- New law and standards: coastal-protection legislation and a Code of Practice are being prepared to govern how these defences are built and maintained.
- Research: a coastal-inland flood model (since 2021) and a dedicated Coastal Protection and Flood Resilience Institute run with NUS.
Frequently asked questions
Will Singapore be underwater by 2050?
No. Median projections for 2050 are in the order of 10 to 25 cm above 2025 levels. The concern for 2050 is more frequent coastal flooding during extreme high tides and storms, not permanent loss of land.
Will Singapore be underwater by 2100?
Not as a whole: most of the island is well above even the high-end 1.15 m projection. The risk is concentrated on low-lying coasts and reclaimed land, and during extreme events, which is where the planned defences go. See the high-end 2100 level on the map.
How much of Singapore is below 5 metres?
About 30% of the island lies less than 5 m above mean sea level, according to the National Climate Change Secretariat. The Green Plan notes that a 4 to 5 m extreme sea level could potentially flood around a third of Singapore.
Can I check whether my home would flood?
Yes, roughly. Open the map, type a postal code into "Will it flood?", and it reads the first sea level at which that spot connects to the sea. Treat it as an estimate with a ±0.75 m margin, not a prediction for a specific building.
How accurate is this map?
It uses the Copernicus GLO-30 elevation model (30 m cells, metre-scale vertical error), smoothed toward bare ground; real OpenStreetMap building footprints; and official population figures spread evenly within each planning area. Violet marks everything the data cannot decide. It is an illustration for understanding scale and geography, not an engineering flood map.
Press Play to watch 2025 → 2150, or compare any level with today.
Sources
- National Climate Change Secretariat, Coastal Protection.
- Singapore Green Plan 2030, Resilient Future.
- Centre for Climate Research Singapore, Singapore's Third National Climate Change Study (V3), 2024.
- Ng et al. (2025), Robust sea-level projections for Singapore by 2100 and 2150, JGR: Oceans.
- IPCC, Sixth Assessment Report, Working Group I (2021), and the NASA/IPCC AR6 sea-level projection tool (Tanjong Pagar).
- Map data: Copernicus GLO-30 DEM (ESA / Airbus); © OpenStreetMap contributors (ODbL); 3D-GloBFP building heights (CC BY 4.0); data.gov.sg; Singapore Department of Statistics.